The results were monitored through a piece of software called Tensorboard in correlation to Tensorflow and the results were verified using a confusion matrix to indicate how accurate the results were.

Results from Neutrality Classifier:
Input:
{
"article_id": "cb3b1c0e-f002-4c8d-8119-b78b0f7578e4",
"fingerprint": [
{"term": "explosion"},
{"term": "rocket"},
{"term": "spacex"}
]
Output:
{
"fingerprint": [
{
"term": "explosion",
"value": "01100101011110000111000001101100011011110111001101101001011011110110111000000000000000000000000000000000000000000000000000000000000000000000000000000000000000000000000000000000000000000000000000000000"
},
{
"term": "spacex",
"value": "01110011011100000110000101100011011001010111100000000000000000000000000000000000000000000000000000000000000000000000000000000000000000000000000000000000000000000000000000000000000000000000000000000000"
}
],
"articleprint": "000000000000010000001300000001110011011000110110100101100101011011100110001101100101001000000110000101101110011001000010000001110100011001010110001101101000011011100110111101101100011011110110011101111001000000000000000000000000",
"articleprint_confidence": {
"0": 0.00020429682626854628,
"1": 0.0036759688518941402,
"2": 0.00007796963473083451,
"3": 0.00016331530059687793,
"4": 0.00024502279120497406,
"5": 0.0003200492064934224,
"6": 0.12933960556983948,
"7": 0.000035599881812231615,
"8": 4.1424223695685214e-7,
"9": 0.00017088760796468705,
"10": 0.03369135037064552,
"11": 2.8050374112353893e-7,
"12": 0.0008010123856365681,
"13": 0.3477279245853424,
"14": 0.00012365169823169708,
"15": 0.0007480414933525026,
"16": 0.002687071682885289,
"17": 0.00021273881429806352,
"18": 0.0005607000784948468,
"19": 0.00032757525332272053
},
"bestChoice": "science and technology"
}
These results were monitored through Tensorboard:
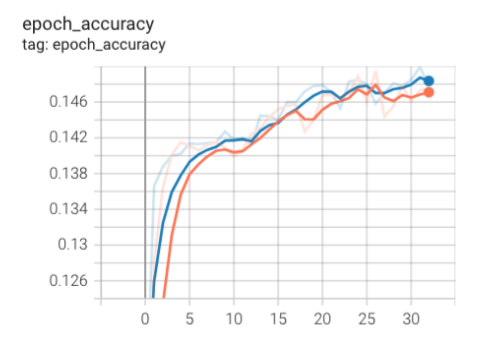
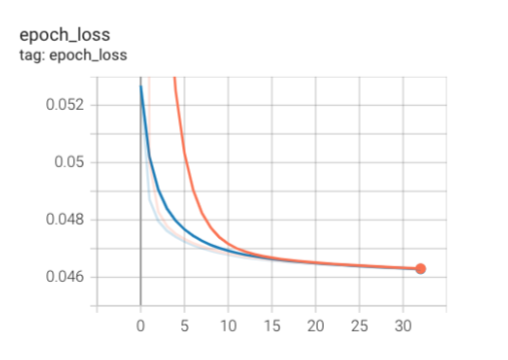
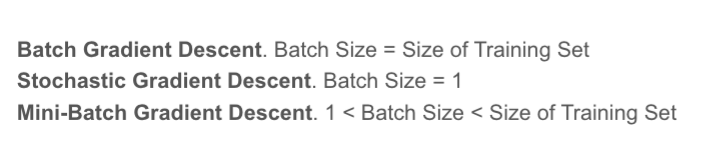
Where the batch size is the number of samples processed before the model is updated and the epochs are the number of complete passes through the training dataset.
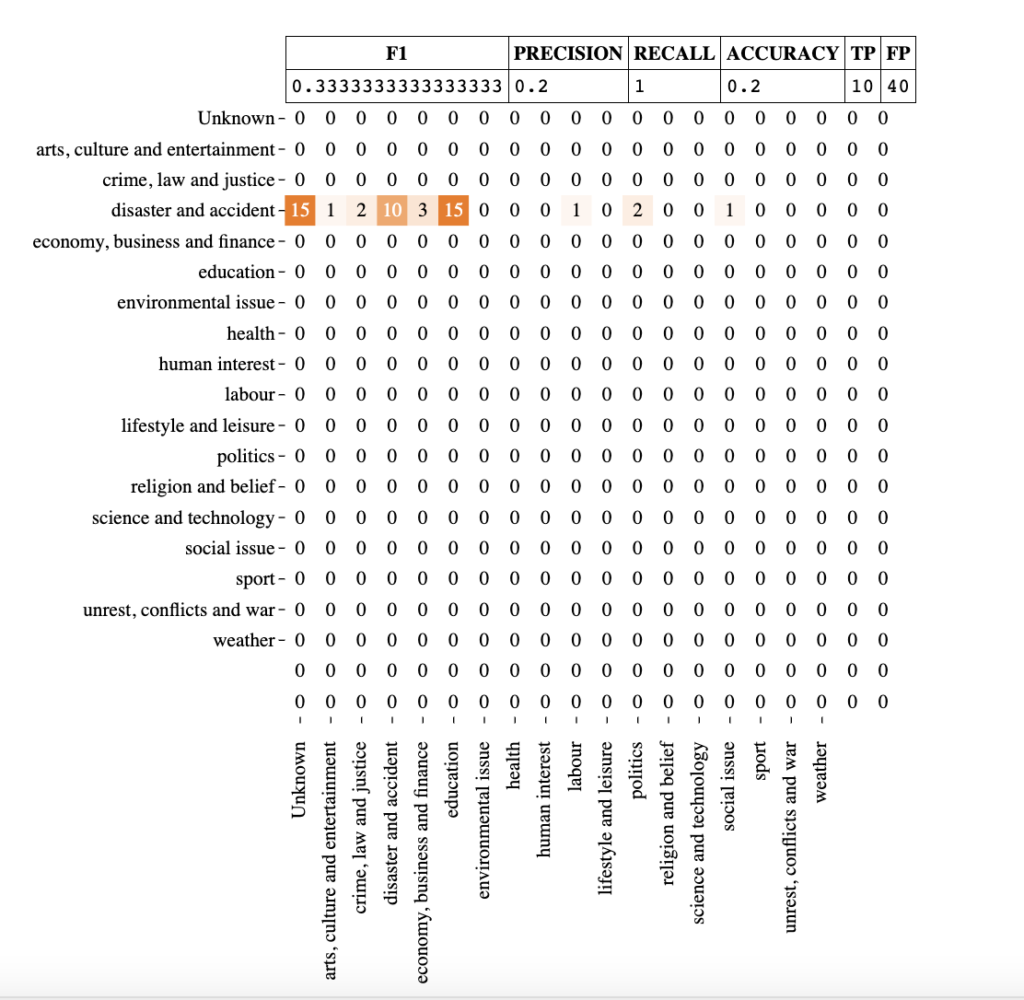
The results were verified using a confusion matrix which is a matrix that represents the prediction summary of how many predictions were correct or not per class.
Leave a Reply